Ask someone their tax bracket and they will usually answer with a single number — 22%, 24%, whatever line item their tax software highlighted. Ask them what share of their income actually went to federal tax and the number they guess is almost always close to that bracket. It shouldn't be, and the gap between the guess and the real number is one of the most consistently misunderstood facts about the U.S. tax system.
The brackets are marginal, not flat
The federal income tax is a graduated system: each bracket's rate applies only to the slice of income that falls inside it, not to all of your income once you cross the threshold. For 2026, a single filer's taxable income is taxed like this:
| Rate | Taxable income range (single) |
|---|---|
| 10% | $0 – $12,400 |
| 12% | $12,400 – $50,400 |
| 22% | $50,400 – $105,700 |
| 24% | $105,700 – $201,775 |
| 32% | $201,775 – $256,225 |
| 35% | $256,225 – $640,600 |
| 37% | above $640,600 |
Married couples filing jointly get roughly double every threshold: 10% up to $24,800, 12% up to $100,800, 22% up to $211,400, 24% up to $403,550, 32% up to $512,450, 35% up to $768,700, and 37% above that. Every one of these figures comes from the IRS's own 2026 inflation adjustments and matches the numbers built into this site's calculators.
Working a real example
Take a single filer earning $130,000 in 2026. Subtract the standard deduction of $16,100 and taxable income is $113,900. That places them in the 24% bracket — but only their last $8,200 of income is taxed at 24%. Here is what they actually owe:
| Bracket | Income taxed in this bracket | Tax owed on this slice |
|---|---|---|
| 10% | $12,400 | $1,240 |
| 12% | $38,000 | $4,560 |
| 22% | $55,300 | $12,166 |
| 24% | $8,200 | $1,968 |
| Total taxable income: $113,900 | Total tax: $19,934 |
Divide $19,934 by $113,900 of taxable income and the effective rate is 17.5% — not 24%. Divide it by the full $130,000 of gross income before the standard deduction and it drops to 15.3%. Either way, it is well below the marginal rate the bracket label suggests.
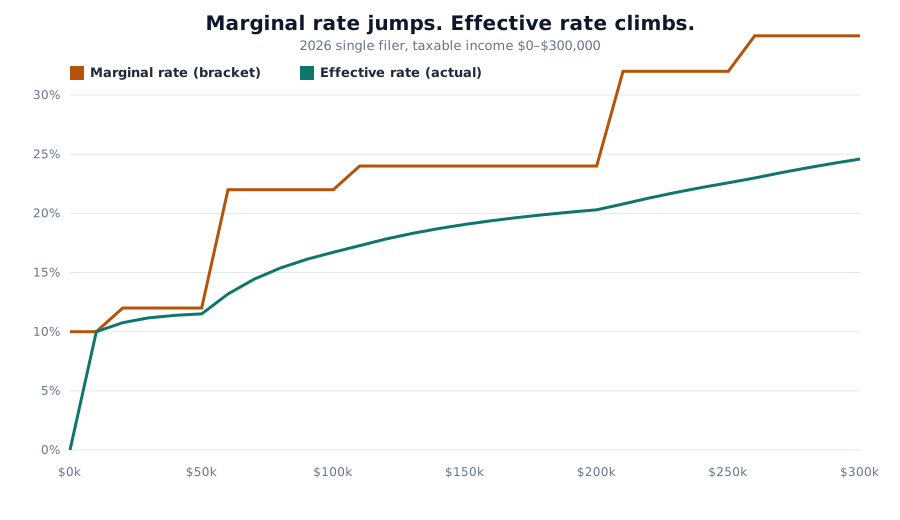
Why "a raise will push me into a higher bracket" is the wrong fear
The most common version of this misunderstanding is the belief that crossing into a higher bracket makes all of your income taxed at the new, higher rate — making a raise potentially not worth it. That is not how it works. Moving from $105,000 to $110,000 in taxable income only exposes the $4,300 above the $105,700 threshold to the 24% rate; the rest of your income keeps being taxed exactly as it was before. A raise can never reduce your after-tax income under this system, because each additional dollar is taxed at the rate for the bracket it falls into and nothing else changes retroactively.
What does move your effective rate
Your effective rate rises with income, but slowly and predictably, because it is a blend of every bracket you have passed through, weighted by how much income sat in each one. It also moves with anything that changes your taxable income rather than your bracket — a larger deduction, a pre-tax retirement contribution, or a tax credit applied after the calculation. A single filer contributing $10,000 to a traditional 401(k) in the example above would reduce taxable income to $103,900, keeping every dollar of that contribution out of the 24% bracket entirely and lowering the effective rate along with the total bill.
The same income, a different filing status
Filing status changes the effective rate even when gross income is identical, because it changes both the standard deduction and the width of every bracket. Take the same $130,000 gross income, but filed as married filing jointly with one earner. The larger $32,200 standard deduction brings taxable income to $97,800 — and because the 2026 joint brackets extend the 12% bracket all the way to $100,800, that entire amount is taxed at 12% or below:
| Bracket | Income taxed in this bracket | Tax owed on this slice |
|---|---|---|
| 10% | $24,800 | $2,480 |
| 12% | $73,000 | $8,760 |
| Total taxable income: $97,800 | Total tax: $11,240 |
That works out to an 11.5% effective rate on taxable income, and 8.6% on gross — well below the single filer's 17.5% and 15.3% on the identical $130,000, and a full bracket lower on the margin (12% versus 24%). None of that is a loophole; it is simply what wider brackets and a larger deduction do to the same income.
Why the thresholds move every year
Every bracket boundary and the standard deduction are indexed to inflation and republished annually by the IRS — the 2026 figures used throughout this article come from Revenue Procedure 2025-32. That indexing exists specifically to prevent "bracket creep," where a cost-of-living raise that leaves your real purchasing power unchanged would otherwise push more of your income into higher brackets purely because the thresholds stayed frozen. It is also why comparing your bracket year over year only means something once you have confirmed the thresholds moved with it.
The bracket names your ceiling, not your bill. "I'm in the 24% bracket" is a true statement about the rate on your next dollar of income. It is very rarely a true statement about the share of your income that goes to federal tax, which is almost always several points lower once every lower bracket has done its share of the work.
This distinction matters most at decision points: whether a bonus, a Roth conversion, or a side-income year is "worth it" after tax, and how much room you have left in your current bracket before the next dollar costs more. Running your actual numbers, rather than reasoning from the bracket label alone, is the only way to see that clearly.