Renting versus buying usually gets argued as if it has one right answer. It doesn’t — it has a break-even year, and that year depends on a handful of numbers that are specific to you: the mortgage rate you’re offered, how long you plan to stay, and how much cash you’d need to walk away with to sell. At today’s rates, that year is later than it was a few years ago, but it still arrives — the question worth answering before you sign anything is when.
The monthly math almost always favors renting at first
As of September 24, 2026, Freddie Mac’s Primary Mortgage Market Survey put the average 30-year fixed rate at 7.03%, up from 6.95% the week before and from 6.30% a year earlier. At that rate, the principal-and-interest payment on a $280,000 loan (a $350,000 home with 20% down) runs about $1,868 a month — before property tax, homeowners insurance, or maintenance are added on top. The national median asking rent in August 2026 was $1,390 a month, per Apartment List’s National Rent Report. Compare those two numbers directly and renting looks like the clear winner, every month, for years.
That comparison is also incomplete, because a mortgage payment buys you something a rent payment doesn’t: a slice of a home you own a little more of every month, sitting inside an asset that (most years) is also gaining value. The rent check builds nothing. The question isn’t which monthly payment is smaller — it’s when the equity you’re building, plus what the home is worth, outweighs the extra cash you spent to get there.
What “break-even year” actually means here
The break-even year is the point where your running total cost of owning — every dollar you’ve paid out, minus the equity you’d walk away with if you sold that day — drops below your running total cost of renting over the same period. Before that year, renting has cost you less in net terms even though your rent checks bought you nothing to keep. After it, owning has cost you less, because the equity you’ve built (home value minus what you still owe, minus what it would cost to sell) outweighs the extra cash you put in along the way.
Two costs work against owning early on: the closing costs paid once at purchase, and the gap between your all-in monthly housing cost and rent. One cost works for owning over time: home equity, which grows both because you’re paying down principal and, most years, because the home’s value rises.
A worked example
Here’s one full run of the numbers (the home price, rate, and assumptions below are a single illustrative scenario, not a prediction for any specific property — always confirm your own numbers with the calculator linked below).
Assume a $350,000 home, 20% down ($70,000), a 30-year fixed loan at 7.03% (this week’s Freddie Mac average), and closing costs at 4% of the loan amount ($11,200) — within LendingTree’s commonly cited 2%-to-6%-of-loan-amount range for closing costs. Add property tax, homeowners insurance, and maintenance at a combined 2.5% of the purchase price per year (about $729 a month) — a simplifying assumption held flat across the example rather than reassessed each year. Rent starts at the $1,390 national median and is modeled growing 3% a year, a long-run rule-of-thumb rate, not a forecast of any specific market (rents were actually roughly flat nationally over the past year, per Apartment List). Home value is modeled appreciating 3.5% a year, also a long-run modeling assumption rather than a forecast. If the home were sold in a given year, selling costs (agent commissions plus closing costs) are assumed at 7% of the sale price, consistent with the roughly 5%-to-8%-of-price range this site’s own reporting on home-sale costs has cited from 2025 NAR data.
Run those numbers month by month and the crossover shows up around year nine. Through year 8, renting is still cheaper in net terms — the extra cash spent owning hasn’t yet been offset by equity. By year 9, the equity built (home value minus the remaining loan balance minus what it would cost to sell) overtakes the cumulative extra cash spent, and owning becomes the cheaper choice from that point forward.
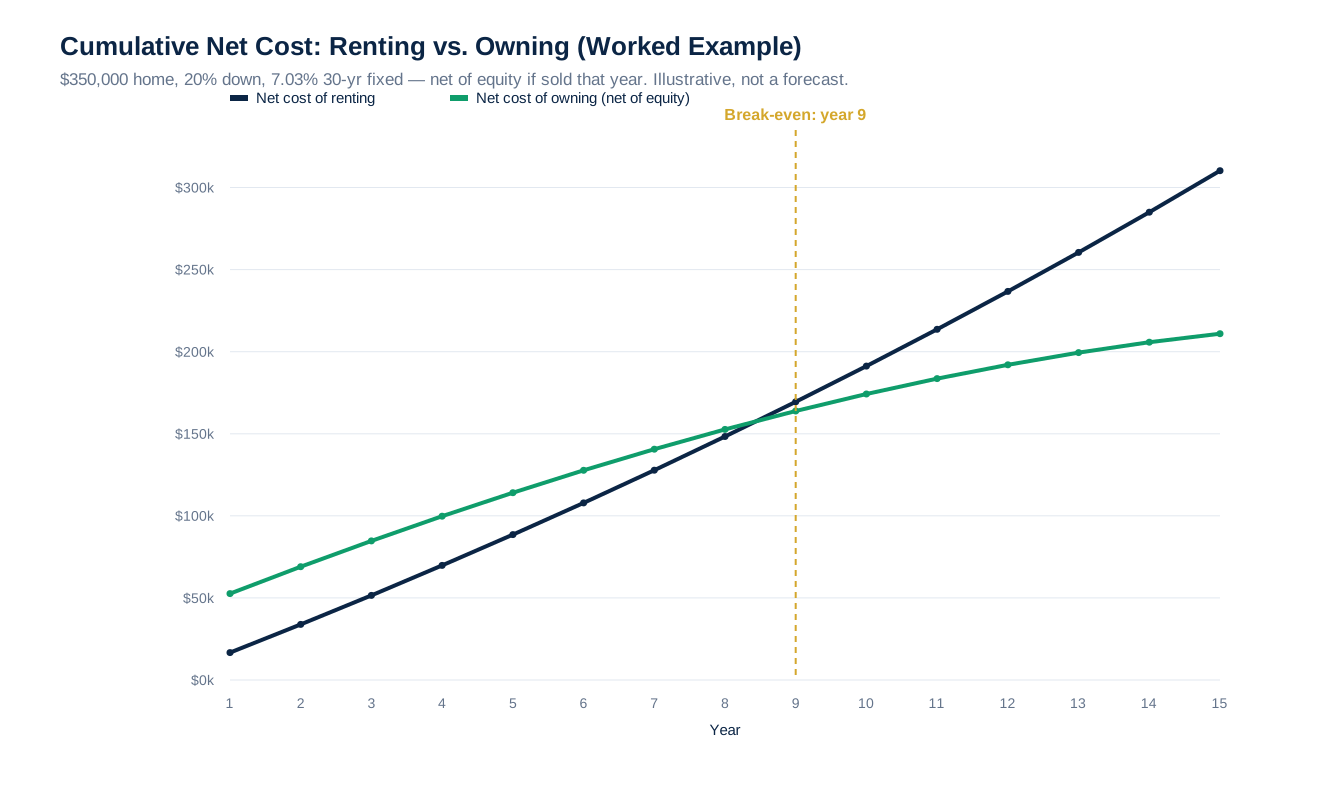
Move any one input and the year moves. A larger down payment lowers the monthly payment and the interest paid, which pulls the break-even year earlier. A lower rate does the same — the same $280,000 loan at 6% instead of 7.03% cuts the monthly payment by roughly $155, which compounds fast. A shorter time horizon works against owning, since closing costs and selling costs are both one-time hits that get spread over fewer years the sooner you sell.
What moves the break-even year earlier or later
- A bigger down payment. Less borrowed means a smaller monthly payment and less interest paid, which shrinks the early-years cash gap against renting.
- The rate you actually qualify for. Credit score, loan type, and points paid at closing all move your real rate away from the survey average — ask your lender for your specific quote before assuming 7.03% applies to you.
- How long you plan to stay. Closing costs and selling costs are both fixed hits paid once; the fewer years you're in the home, the more those one-time costs weigh against you per year of ownership.
- Local property tax and insurance. Both vary enormously by state and by flood/wildfire/hurricane exposure — the 2.5%-of-price combined assumption above is a national-level simplification, not a number to use for a specific address.
- What actually happens to home prices and rent where you're looking. The example uses long-run national averages for both; a market that's cooling or a rental market with unusually low vacancy will move the real answer in either direction.
The break-even year isn’t the only question worth asking
Money isn’t the only variable in this decision, even on a site built around calculators. Renting keeps you free to move for a job, a relationship, or simply a neighborhood you like better, without a home to sell first — that flexibility has real value that doesn’t show up in a break-even year. It also means someone else is responsible for the roof, the furnace, and the water heater, which is a genuine cost saving on top of being one less thing to manage. Owning trades that flexibility for control: nobody can decline to renew your lease, and the money in your monthly payment builds something that’s yours rather than a landlord’s. Neither trade-off is a mistake — they’re just different things to be buying, and the break-even year only prices the piece of the decision that’s actually financial.
It’s also worth separating “renting is currently cheaper than owning here” from “renting is always the smarter move.” The math above is specific to today’s 7%-range mortgage rates; the last time rates sat near 3%, the same $280,000 loan carried a monthly payment several hundred dollars lower, and the break-even year arrived correspondingly sooner. Rates move. If yours drops meaningfully after you buy, a refinance (its own break-even calculation, on the costs of refinancing versus the payment saved) can pull your original purchase’s break-even year earlier than the scenario you first ran.
Before you count on breaking even
None of this accounts for what else you could have done with the money — investing the down payment instead, for instance — because that comparison depends on an assumed rate of return this article isn’t going to guess at for you. It also doesn’t account for renovations, HOA dues if the home has one, or a rate you refinance into later. And it assumes you sell at the end of the period modeled; if you plan to keep the home and never sell, the “selling costs” line disappears from the math entirely, which pulls the real break-even year earlier than the worked example above. The calculator linked below runs this same style of comparison against your actual home price, rate, down payment, and how long you expect to stay, and it’s worth running before any offer goes in, not after.
Questions about the arithmetic above, or think we got a number wrong? Write to us at Info@smartfinclub.com.